
Jakość powietrza w Polsce
10K+
Downloads

Everyone
info


About this app
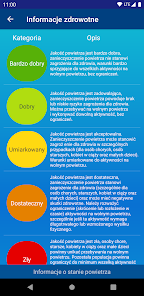
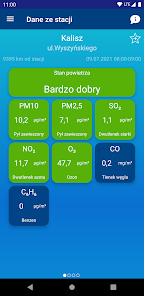
Application of the Chief Inspectorate of Environmental Protection entitled "Air quality in Poland" presents current data on air quality from automatic measurement stations operating under the State Environmental Monitoring (SEM). One-hour measurements of the concentrations of suspended dust PM10 and PM2.5, sulfur dioxide (SO2), nitrogen dioxide (NO2) and ozone (O3) are presented in the form of an index with a six-point scale (from "very good" to "very bad"), relating to to the potential health effects of pollution. One-hour measurements of carbon monoxide (CO) and benzene (C6H6) concentrations are presented in the form of markers of three sizes in a uniform color. In addition, the application presents air quality forecasts for PM10 dust, sulfur dioxide (SO2), nitrogen dioxide (NO2) and ozone (O3).
Information on air quality is presented in the form of maps, charts and summaries of detailed measurement results.
THE MOST IMPORTANT FEATURES:
With Internet access and location services enabled, the application shows data from the nearest measuring station or from other selected stations.
The application presents air quality forecasts for the current day and two consecutive days for the entire territory of Poland.
MAIN COMPONENTS:
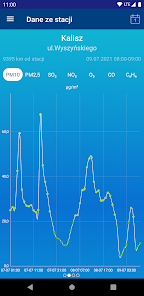
- DATA FROM THE NEAREST STATION - displaying current data on concentrations of pollutants from the station closest to the user.
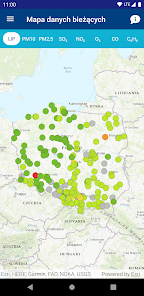
- CURRENT DATA MAP - displaying current data on pollution from all automatic stations in Poland.
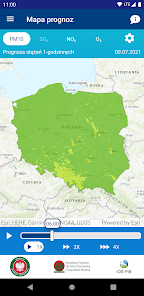
- FORECAST MAP - displaying air quality forecast maps for today and the next two days.
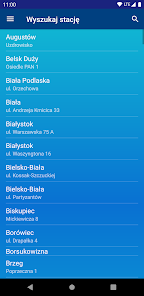
- FIND STATION - a list of automatic measuring stations operating within the SEM (addresses: city and street) and allowing for displaying data from stations by their addresses.
- WARNINGS - information on the occurrence of high concentrations of pollutants exceeding the information or alert levels.
- NEWS - information on news posted on the CIEP air quality portal (e.g. information on the publication of air quality reports).
- VISIT CIEP PORTAL - redirection to the CIEP air quality portal.
The measurement results presented in the application come from the national air quality database of the Chief Inspectorate of Environmental Protection. They are updated every hour on the basis of data recorded from SEM measurement stations. The data presented by the application come only from SEM automatic measuring stations and are not interpolated. The presented data is prior to final verification and is subject to change. The data is presented in local time.
Air quality forecasts are prepared by the Institute of Environmental Protection - National Research Institute and are updated daily.
Using GPS running in the background may increase battery consumption. The application requires an internet connection. Using packet data may result in additional charges.
The application was made by Evertop Sp. z o.o. on behalf of the Chief Inspectorate of Environmental Protection under the project "Strengthening the air quality assessment system in Poland based on Norwegian experience" under the Operational Program PL03 "Strengthening environmental monitoring and control activities" co-financed by the EEA Financial Mechanism 2009-2014. The development of the application was financed by the National Fund for Environmental Protection and Water Management.
The application is the official application of the Chief Inspectorate of Environmental Protection.
NEW PRODUCTS:
A new method of presenting one-hour measurement results of benzene and carbon monoxide concentrations has been introduced.
The module "Map of forecasts" has been added to present forecasts of air pollution with PM10 particulate matter, nitrogen dioxide (NO2), sulfur dioxide (SO2) in winter, and tropospheric ozone (O3) in summer. In the settings panel available in the upper right part of the screen, you can select the type and day of the forecast (forecast for the current day and two consecutive days).
Information on air quality is presented in the form of maps, charts and summaries of detailed measurement results.
THE MOST IMPORTANT FEATURES:
With Internet access and location services enabled, the application shows data from the nearest measuring station or from other selected stations.
The application presents air quality forecasts for the current day and two consecutive days for the entire territory of Poland.
MAIN COMPONENTS:
- DATA FROM THE NEAREST STATION - displaying current data on concentrations of pollutants from the station closest to the user.
- CURRENT DATA MAP - displaying current data on pollution from all automatic stations in Poland.
- FORECAST MAP - displaying air quality forecast maps for today and the next two days.
- FIND STATION - a list of automatic measuring stations operating within the SEM (addresses: city and street) and allowing for displaying data from stations by their addresses.
- WARNINGS - information on the occurrence of high concentrations of pollutants exceeding the information or alert levels.
- NEWS - information on news posted on the CIEP air quality portal (e.g. information on the publication of air quality reports).
- VISIT CIEP PORTAL - redirection to the CIEP air quality portal.
The measurement results presented in the application come from the national air quality database of the Chief Inspectorate of Environmental Protection. They are updated every hour on the basis of data recorded from SEM measurement stations. The data presented by the application come only from SEM automatic measuring stations and are not interpolated. The presented data is prior to final verification and is subject to change. The data is presented in local time.
Air quality forecasts are prepared by the Institute of Environmental Protection - National Research Institute and are updated daily.
Using GPS running in the background may increase battery consumption. The application requires an internet connection. Using packet data may result in additional charges.
The application was made by Evertop Sp. z o.o. on behalf of the Chief Inspectorate of Environmental Protection under the project "Strengthening the air quality assessment system in Poland based on Norwegian experience" under the Operational Program PL03 "Strengthening environmental monitoring and control activities" co-financed by the EEA Financial Mechanism 2009-2014. The development of the application was financed by the National Fund for Environmental Protection and Water Management.
The application is the official application of the Chief Inspectorate of Environmental Protection.
NEW PRODUCTS:
A new method of presenting one-hour measurement results of benzene and carbon monoxide concentrations has been introduced.
The module "Map of forecasts" has been added to present forecasts of air pollution with PM10 particulate matter, nitrogen dioxide (NO2), sulfur dioxide (SO2) in winter, and tropospheric ozone (O3) in summer. In the settings panel available in the upper right part of the screen, you can select the type and day of the forecast (forecast for the current day and two consecutive days).
Updated on
Safety starts with understanding how developers collect and share your data. Data privacy and security practices may vary based on your use, region, and age. The developer provided this information and may update it over time.

No data shared with third parties
Learn more about how developers declare sharing

No data collected
Learn more about how developers declare collection

Data is encrypted in transit

Data can’t be deleted
What's new
W wersji 1.3.0 dodano wyświetlanie wartości średniej dla danej doby (liczonej jako wyniki pomiarów od godz. 1:00 do 0:00 czasu lokalnego) dla pyłu zawieszonego PM10 i PM2,5, dwutlenku azotu i dwutlenku siarki. Ponadto, w sekcji „Aktualności” dodano aktualności publikowane na wojewódzkich podstronach portalu Jakość Powietrza. Rozbudowę aplikacji mobilnej sfinansowano ze środków Narodowego Funduszu Ochrony Środowiska i Gospodarki Wodnej.